Behind the Scenes: Openfire Optimization
Dec. 19, 2005
by Gaston Dombiak and Matt Tucker
A major priority for Openfire is to provide the fastest and most scalable XMPP server implementation available. The Pampero project will be the major effort over the next several months to help us achieve that goal. However, one side-affect of Pampero is that the core Openfire Server instance will need to handle and route many more packets per second. So, to prepare for Pampero development, we embarked on an optimization project for the core server that improved performance by at least 33%.
All of this work was performed as we renamed the server to Openfire from Jive Messenger. What follows is the story of our quest to make Openfire significantly faster vs. the previous (already fast) Jive Messenger release.
Profiling Basics
As a pure Java server, one of the best weapons in our optimization arsenal is the profiler. In this case, JProfiler was used to analyze server performance and to find hotspots --specific parts of the code where the CPU spends a lot of time. So, profiling let us figure out exactly where we should focus our optimization efforts.
Before diving into the details of the work we did, we always feel obligated to preface any optimization discussion with the principles we keep in mind when doing profiling and optimization work:
- Never optimize before it's needed.
We always build code to be simple and easy to maintain. We only optimize the code when it becomes specifically clear that it's necessary. - Clear code is better than a 0.5% performance improvement.
We don't apply a minor optimization when it will make the code much harder to understand or maintain. Over-optimization is an easy trap to fall into. - Profilers can lie.
Profilers can sometimes give false-positives for hotspots, which can be a really tricky problem. For example, profilers often identify System.currentTimeMillis() as an expensive operation, probably because it involves a native OS call. However, if you time half a million calls to that method outside of a profiler, they're very fast. It's important to be able to do constant real-world measurements of how optimizations affect performance to keep the profiling process honest.
On to the Optimizations!
An XMPP server should spend most of its time doing network operations or parsing XML since those are two things that can never be optimized away. With this in mind we analyzed an initial run of the profiling tool:

As you can see, most of the time was spent doing String manipulation (62%) and only a small percentage of time performing network I/O or parsing XML. This was a surprising and disturbing finding, but we knew we were on the hunt for some big performance improvements.
Most of the String manipulation operations were quickly tracked down to the core packet classes. More precisely, many user address (JID) objects were being created each time the methods Packet.getFrom() or Packet.getTo() were being called. Other expensive operations included JID.toString() and JID.toBareJID().
After caching the String representation of the JID and caching the "to" and "from" JIDs of packets, the profile picture started to look much better. However, profiling uncovered quite a few other optimizations. Some of these optimizations were quite minor, but they all added up nicely as we'll see later. A partial list of the optimizations:
- Initialize StringBuilder objects with the proper size.
By default, a StringBuilder object can hold up to 16 characters before automatically re-sizing itself. Providing better default StringBuilder capacities in the code helped to prevent the JVM from wasting time growing and copying arrays of Strings. As an example, because we know stream headers have a size of around 500 characters, we could size that StringBuilder appropriately. Note: we use StringBuilder instead of StringBuffer to avoid un-necessary synchronization. - Change the way the server was monitoring sockets.
Because the underlying TCP/IP layer doesn't always inform Java about dead sockets, it used to be possible for the server to wait forever in a socket flush or write operations. Therefore, we had added tracking logic to the 2.3 release to force sockets closed if write operations took too long. Profiling told us the implementation of that feature was a bottleneck, so we optimized the monitoring algorithm. - Don't throw exceptions for non-exceptional behavior.
Throwing an exception in Java is fairly expensive since the JVM has to construct a full stack trace. Therefore, exceptions should not be thrown as part of normal application logic. We found a couple of places in the code base that needed to be fixed. As an example, each time a route to a client was not found a NoSuchRouteException was created. Instead of throwing an exception we changed the API to return null when a route is not found. - Avoid packet copying.
Packets are represented using a DOM4J XML model, so are expensive to copy. There were a few places in the code that performed unnecessary packet copying. For example, packets were being copied to add to the room history of a MUC room even when the room history was disabled (meaning the copied packet would get thrown away later without being used). Creating fewer objects also helps with garbage collection in general. - Fix routing table bottleneck.
The routing table was a bottleneck when many MUC clients were trying to send packets to other users at the same time. Even though the routing table operation was quite fast, it was being executed so many times that it was still a bottleneck. To use an analogy -- a single grain of sand is fairly insignificant, but enough of them together constitute a beach. The simple optimization was to store a reference to the client session with each MUCUser object instead of using the routing table to lookup the session every time it was needed.
After all these optimizations, the profiler picture was as follows:

The server is now spending 51% doing network I/O and parsing XML. String operations declined from 62% to 5%. In other words, the server is now spending most of the time doing what it's supposed to.
Real-world Measurements
How do these optimizations affect real-world performance? To evaluate the impact, we prepared a simple stress test. Our test consisted of users logging in, sending messages back and forth, and then logging out. Some stats on the testing setup:
- 140 concurrent users.
- Each user sent 100 messages with a delay of 5 milliseconds (14K total messages sent).
- The server installations ran on a developer notebook: Dell Inspiron 9200 with a 2Ghz CPU and 2GB RAM.
- MySQL as the back-end database, also running on the notebook.
- JVM params: -Xms20m -Xmx128m -Xss16k -server
- The load testing application was written using Smack and was executed from a desktop computer running a single JVM.
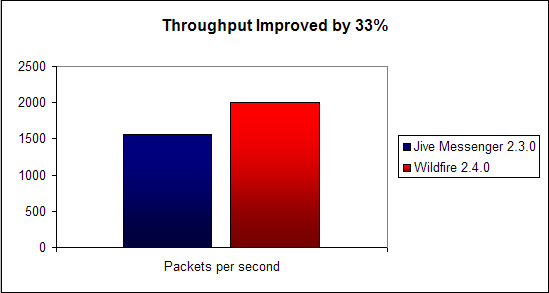
Openfire 2.4.0 handles 500 more packets per second than Jive Messenger 2.3.0.
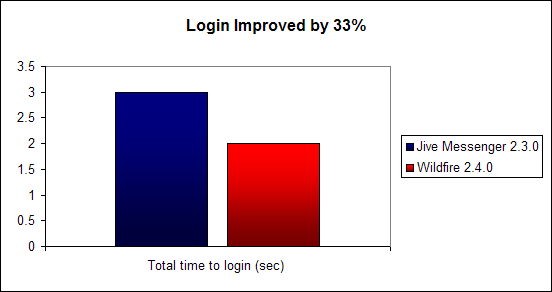
Openfire 2.4.0 improves login time vs. Jive Messenger 2.3.0 by 33%.
Future Work
We're quite happy with the 33% performance improvement that only a few days of optimization work yielded. It's likely that measured performance improvements would be even greater on multi-CPU servers, since we eliminated a lot of synchronization in the code.
We'll likely go through another round of profiling in about six months - we've found that to be a good interval to catch hotspots introduced by refactoring and new features. Until then, our focus will shift to the Pampero project, which is the next big opportunity for performance improvements in Openfire.